Sharing Dynamic Data between WebParts
Sharing data between WebParts it's a very cool feature of the SharePoint Framework. When I tried this feature, the first thing that came to my mind was to build a dashboard that looks like a PowerBI report.
The idea is to have one host WebPart that connects to a data source and provides an interface to filter the data. The client WebParts get the filtered data from the host and show interactive charts. Everytime the user change the filters, the charts automatically show the new values.
With this approach, there is only one connection to the data source (e.g. a SharePoint List) and we can fill the page with many instances of the client WebPart that consume the data from the host. In this project, I tried to make a generic solution that can be used with many business rules. The trick is to make use of denormalized data. In fact, the more redundant the data is, more flexibility we can get from it.
So, this project consists on two WebParts. One of them will be the host and the other one is the client. The client WebPart provides three kinds of widgets:
- Pie chart
- Bar/Line chart
- KPI Card
I used chart.js for the widgets.
In the host, we can choose wich fields we will use as filter. In the above example, I choose "Year" and "Month". On the client, we can choose wich fields we bind to the Axis of the charts. One important thing in this project is to define which fields we can bind to the Widget's Axes. For the labels (X-Axis) we only can choose non-numeric fields. In the example, I use month names. We could also use "years" but only if it's defined as a non-numeric field of the list. For the Y-Axis, we can only choose numeric fields, in order to sum the values.
That is more and less how PowerBI works.
Let's start with it!
Take a look here for the documentation about how the Dynamic Data works. It's very simple and cool. I made a few adjustments since I want to pass an entire DataSet as an object to the client WebParts.In the host, I defined two DataSet objects. One is the raw data and the other one is the filtered data we want to pass to the clients. In short, I have this:
export class DataSet {
    public title : string;
    public description : string;
    public columns : Array<DataSetColumn>;
    public rows : Array<DataSetRow>;

    constructor() {
        this.title = "";
        this.description = "";
        this.columns = new Array<DataSetColumn>();
        this.rows = new Array<DataSetRow>();
    }
}

export enum DataSetColumnType {Text="text", Number="number", Date="date"}
export class DataSetColumn {
    public index : number;
    public name : string;
    public type : DataSetColumnType;
}

export class DataSetRow {
    public index: number;
    public values: Array<Object>;
}
  protected onInit(): Promise<void> {

    this.context.dynamicDataSourceManager.initializeSource(this);

    this.context.dynamicDataSourceManager.updateMetadata({
      title: this.properties.title,
      description : this.properties.description
    });


    this.lastMockDataProperty = this.properties.mockData;

    return this.retrieveData();

  }
  private dataSet : DataSet;
  private filteredData: DataSet;
 /**
   * Return the current value of the specified dynamic data set
   * @param propertyId ID of the dynamic data set to retrieve the value for
   */
  public getPropertyValue(propertyId: string): any {
    switch (propertyId) {
      case 'bi_dataset':
        return this.filteredData;

    }

    throw new Error('Bad property id');
  }
 private updateFilteredData(){
    this.filteredData = this.getFilteredData();
    this.context.dynamicDataSourceManager.notifySourceChanged();
  }
I also used this control to choose the SharePoint list and used REST to get data from it.
On the client:
export enum WidgetType  {Chart = 1, Pie=2, KPI = 3}
export enum ChartType { SingleBars=1, DoubleBars=2, SingleLines=3, DoubleLines=4}

export interface IBiClientWebPartProps {
  title: string;
  label: string;
  value: string;
  secondaryValue: string;
  bi_dataset: DynamicProperty<Object>;
  widget : WidgetType;
  chartType:ChartType;
  maxHeight : number;
}

var Chart : any = require("chart.js");

export default class BiClientWebPart extends BaseClientSideWebPart<IBiClientWebPartProps>  {

  private static DATA_KEY : string = "bi_dataset";
  private static MIN_HEIGHT : number = 200;

  private widgetData : any;
  private dataSet : any;
  private lastWidgetTitle : string;

  protected onInit(): Promise<void> {

    if (this.properties.bi_dataset){
      try{
        this.dataSet = this.properties.bi_dataset.tryGetValue();
      }catch(error){
        console.error(error);
      }
    }

    return Promise.resolve();
  }


  public render(): void {


    if (this.properties.bi_dataset){
      this.dataSet = this.properties.bi_dataset.tryGetValue();
    }

    if (!this.renderedOnce || this.properties.title == this.lastWidgetTitle){
      this.domElement.innerHTML = `<div class="${styles.biClient}"><div class="${styles.widget_title}">${this.properties.title}</div><div class="widget-zone"></div></div>`;

      if (this.dataSet){

        switch(this.properties.widget){
          case WidgetType.Pie:
            this.widgetData = this.getValuesForPie();
            this.drawPie();
          break;

          case WidgetType.Chart:
          this.widgetData = this.getValuesForChart();
            this.drawChart();
          break;

          case WidgetType.KPI:
          this.widgetData = this.getValuesForKPICard();
            this.drawKPICard();
          break;

          default:
            this.widgetData = this.getValuesForPie();
            this.drawPie();
          break;
        }
      }
    } else if (this.properties.title != this.lastWidgetTitle){

      let title = this.domElement.getElementsByClassName(styles.widget_title)[0];
      if (title) title.innerHTML = this.properties.title;

    }

    this.lastWidgetTitle = this.properties.title;

  }
protected getPropertyPaneConfiguration(): IPropertyPaneConfiguration {
    return {
      pages: [

        {
          displayGroupsAsAccordion: false,
          groups: [
            {
              groupName : strings.DataSourceLabel,
              groupFields: [
                PropertyPaneDynamicField("bi_dataset", {
                  label:"",
                  propertyValueDepth: DynamicDataSharedDepth.None,
                  filters:{
                    propertyId:BiClientWebPart.DATA_KEY
                  }
                }),
                PropertyPaneTextField("title", {
                  label: strings.TitleLabel
                })
              ]
            },
            this.getWidgetGroup()
          ]
        }
      ]
    };
  }
This is how both property panes look like:

And this is how this example's denormalized data looks like:
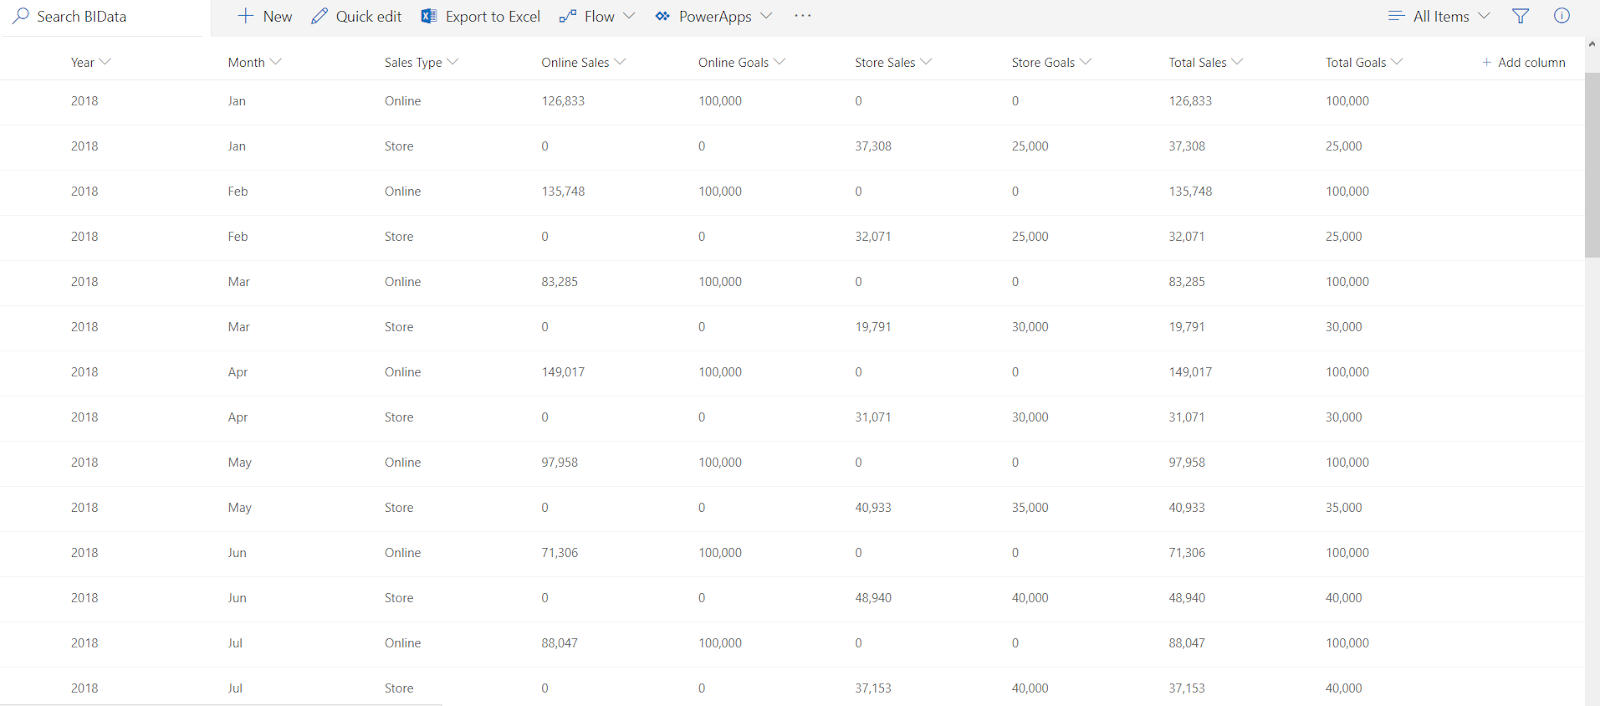
All the details of the project can be found at GitHub.


sharepoint training
ReplyDeletesql azure training